ObservePoint TagDebugger 1.24.1 CRX for Chrome
A Free Developer Tools Extension
Published By www.observepoint.com/tag-debugger
ObservePoint TagDebugger (daejfbkjipkgidckemjjafiomfeabemo): Troubleshoot and audit analytics tags, variables and on-click events. Supports Adobe Analytics, Google Analytics, Ensighten and more... Read More > or Download Now >
ObservePoint TagDebugger for Chrome
Tech Specs
- • Type: Browser Extension
- • Latest Version: 1.24.1
- • Require: Chrome 49.0 and up
- • Offline: Yes
- • Developer: www.observepoint.com/tag-debugger
User Reviews

- • Rating Average
- 4.1 out of 5
- • Rating Users
- 52
Download Count
- • Total Downloads
- 140
- • Current Version Downloads
- 0
- • Updated: April 15, 2024
ObservePoint TagDebugger is a free Developer Tools Extension for Chrome. You could download the latest version crx file or old version crx files and install it.
More About ObservePoint TagDebugger
ObservePoint’s TagDebugger is a free Chrome Extension for troubleshooting analytics and marketing tags on your live website. TagDebugger captures page-load and event-triggered requests for marketing and analytics tags and parses them into a human-readable format, allowing for easy tag debugging.
TagDebugger is the first step towards comprehensive and efficient governance of your analytics and marketing tags. ObservePoint’s full suite of analytics testing and tag governance solutions can help you:
Scan batches of pages or sequences of actions to verify accurate data collection
Monitor your live implementation for errors in analytics tracking and variable formatting
Test analytics in development and staging environments before releasing into the wild
Receive notifications whenever your implementation fails expectations
Schedule a demo to see how ObservePoint can help you automate and scale analytics testing and tag governance on your entire website: https://www.observepoint.com/demo-request/
MORE ABOUT TAGDEBUGGER
--------------------------------------------
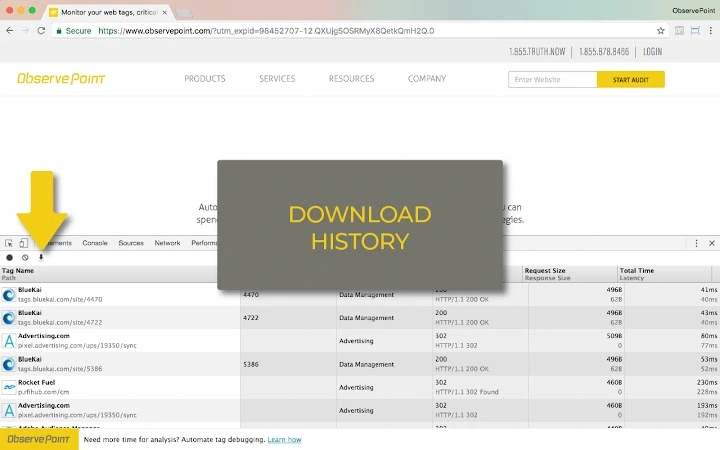
TagDebugger is designed to help you debug analytics and marketing tags on a page-by-page basis. After installing the TagDebugger extension, you will see a new tab in your Chrome Developer Tools. Simply open this tab, refresh the page, and you will see which marketing and analytics tags are firing on your website.
For each tag, you will see the following information:
Tag Name (e.g. Google Universal Analytics, Adobe Analytics, Ensighten, Floodlight)
Account (e.g. UA-12345678, mywebsite)
Category (e.g. Analytics, Advertising, Social, Tag Management)
Status (standard HTTP response codes)
Request size/Response size
Total Time/Latency
Basic Debugging
-----------------------
Clicking into each tag allows you to see the server request formatted as an easy-to-read, categorized hierarchy of variables. You can also view the actual request in both its HTML-encoded and decoded formats.
To clear the log, simply click the “Clear tag requests” button at the top of the extension’s interface.
Debugging on-click events and cross-domain tracking
-----------------------------------------------------------------------
By default, TagDebugger clears the log of requests upon navigating to a new page. By toggling the Record button in the extension’s interface, users can make the log persist when navigating from page to page. This will assist in troubleshooting on-click events and cross-domain tracking.
Downloading data
------------------------
Users can download a tab-delimited copy of the request log by clicking on the “Export data” button at the top of the interface. This data will appear in your Downloads folder as observepoint.data, and may be limited by the size of the data in the panel
GET STARTED
---------------
TagDebugger is an excellent alternative for anyone who may currently use one or more of the following solutions: WASP, Charles, Fiddler, OmniBug, Adobe Debugger, or Tag Inspector.
To use this extension, follow these five easy steps:
1. Ensure the extension is enabled by selecting More Tools from the Google Chromes’ ellipses menu, then selecting Extensions, and verifying the ObservePoint TagDebugger is enabled.
2. Open the Chrome Developer Tools. (On Windows and Linux, press Control-Shift-i. On Mac, press Command-Option-i.)
3. Select the ObservePoint panel.
4. Refresh the page you are on.
5. Click on a tag to start debugging.
By installing this extension, you agree to the ObservePoint Terms of Service at http://www.observepoint.com/terms-of-use
For more information on the TagDebugger, as well as its companion report comparison tool, TagCompare, visit: https://www.observepoint.com/tag-debugger/
TagDebugger is the first step towards comprehensive and efficient governance of your analytics and marketing tags. ObservePoint’s full suite of analytics testing and tag governance solutions can help you:
Scan batches of pages or sequences of actions to verify accurate data collection
Monitor your live implementation for errors in analytics tracking and variable formatting
Test analytics in development and staging environments before releasing into the wild
Receive notifications whenever your implementation fails expectations
Schedule a demo to see how ObservePoint can help you automate and scale analytics testing and tag governance on your entire website: https://www.observepoint.com/demo-request/
MORE ABOUT TAGDEBUGGER
--------------------------------------------
TagDebugger is designed to help you debug analytics and marketing tags on a page-by-page basis. After installing the TagDebugger extension, you will see a new tab in your Chrome Developer Tools. Simply open this tab, refresh the page, and you will see which marketing and analytics tags are firing on your website.
For each tag, you will see the following information:
Tag Name (e.g. Google Universal Analytics, Adobe Analytics, Ensighten, Floodlight)
Account (e.g. UA-12345678, mywebsite)
Category (e.g. Analytics, Advertising, Social, Tag Management)
Status (standard HTTP response codes)
Request size/Response size
Total Time/Latency
Basic Debugging
-----------------------
Clicking into each tag allows you to see the server request formatted as an easy-to-read, categorized hierarchy of variables. You can also view the actual request in both its HTML-encoded and decoded formats.
To clear the log, simply click the “Clear tag requests” button at the top of the extension’s interface.
Debugging on-click events and cross-domain tracking
-----------------------------------------------------------------------
By default, TagDebugger clears the log of requests upon navigating to a new page. By toggling the Record button in the extension’s interface, users can make the log persist when navigating from page to page. This will assist in troubleshooting on-click events and cross-domain tracking.
Downloading data
------------------------
Users can download a tab-delimited copy of the request log by clicking on the “Export data” button at the top of the interface. This data will appear in your Downloads folder as observepoint.data, and may be limited by the size of the data in the panel
GET STARTED
---------------
TagDebugger is an excellent alternative for anyone who may currently use one or more of the following solutions: WASP, Charles, Fiddler, OmniBug, Adobe Debugger, or Tag Inspector.
To use this extension, follow these five easy steps:
1. Ensure the extension is enabled by selecting More Tools from the Google Chromes’ ellipses menu, then selecting Extensions, and verifying the ObservePoint TagDebugger is enabled.
2. Open the Chrome Developer Tools. (On Windows and Linux, press Control-Shift-i. On Mac, press Command-Option-i.)
3. Select the ObservePoint panel.
4. Refresh the page you are on.
5. Click on a tag to start debugging.
By installing this extension, you agree to the ObservePoint Terms of Service at http://www.observepoint.com/terms-of-use
For more information on the TagDebugger, as well as its companion report comparison tool, TagCompare, visit: https://www.observepoint.com/tag-debugger/
![]()